Understanding Relative Strength Index (RSI)
The Relative Strength Index (RSI) is a powerful and widely-used momentum oscillator in the world of technical analysis. Created by J. Welles Wilder Jr. in 1978, RSI measures the speed and change of price movements and is primarily used to identify overbought or oversold conditions in a market. As a tool, RSI helps traders assess the strength of a stock, currency, or any other asset, indicating whether an asset is potentially overvalued or undervalued, and thus likely to undergo a price correction.
The Concept of RSI
Definition of RSI
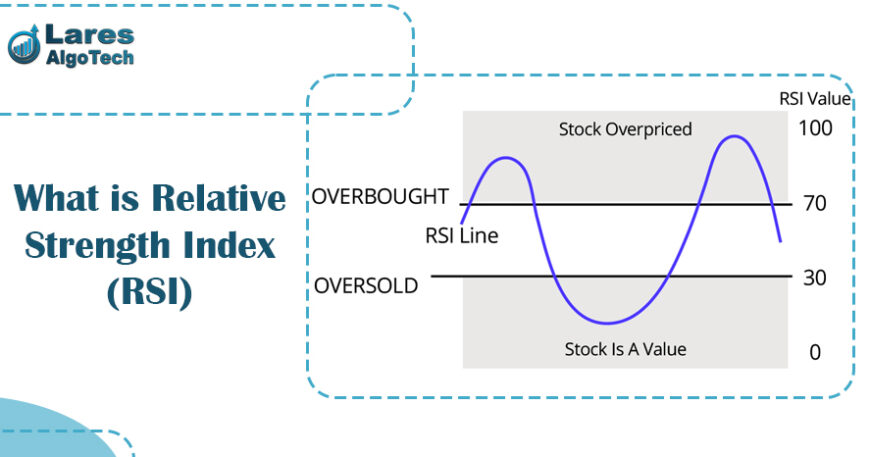
RSI is a momentum oscillator that ranges between 0 and 100. It is designed to identify the speed and change of price movements. Traditionally, RSI values above 70 are considered overbought, suggesting that the asset may be due for a pullback. Conversely, RSI values below 30 indicate that the asset might be oversold, pointing to a potential upward reversal.
How RSI Measures Momentum
Momentum refers to the rate at which the price of an asset increases or decreases. RSI measures this momentum by comparing the magnitude of recent gains to recent losses. By quantifying these price movements, RSI can provide insight into whether the asset’s current trend is sustainable or if it is likely to reverse.
The RSI Formula Explained
The RSI is calculated using the following formula:
RSI=100−(1001+RS)RSI = 100 – \left(\frac{100}{1 + RS}\right)
Where RS (Relative Strength) is the average of “X” periods’ closes up divided by the average of “X” periods’ closes down. Typically, the RSI is calculated over 14 periods.
Historical Background of RSI
Origin of RSI
The Relative Strength Index was developed by J. Welles Wilder Jr., a mechanical engineer turned technical analyst, and was first introduced in his 1978 book “New Concepts in Technical Trading Systems.” Wilder designed the RSI to simplify the process of evaluating the strength or weakness of an asset’s price.
Evolution and Adoption in Trading
Since its introduction, the RSI has become one of the most commonly used indicators in technical analysis. Traders and analysts worldwide utilize RSI due to its simplicity and effectiveness in various market conditions.
Importance of RSI in Technical Analysis
Why RSI is a Popular Indicator
The popularity of RSI stems from its ability to provide clear signals about overbought and oversold conditions, making it an essential tool for traders aiming to identify potential reversal points. Its adaptability across different asset classes and timeframes further enhances its utility.
RSI vs. Other Momentum Indicators
Compared to other momentum indicators like the Moving Average Convergence Divergence (MACD) or the Stochastic Oscillator, RSI offers a unique blend of simplicity and insight. While MACD is used to identify changes in the strength, direction, momentum, and duration of a trend, RSI is more focused on the price’s immediate momentum, making it more straightforward in some trading strategies.
Applications in Different Markets
RSI is versatile and can be applied to various financial markets, including stocks, forex, commodities, and cryptocurrencies. Its ability to signal overbought and oversold conditions makes it valuable for both short-term traders and long-term investors.
How RSI is Calculated
Explanation of RSI Formula
The calculation of RSI involves a straightforward formula that requires the average gain and average loss over a specified period, typically 14 periods. The formula converts these averages into a single line that oscillates between 0 and 100, providing a visual representation of market momentum.
Step-by-Step Calculation
- Calculate the average gain and average loss over the chosen period.
- Divide the average gain by the average loss to get the Relative Strength (RS).
- Use the RSI formula to convert RS into an RSI value.
- Plot the RSI value on a chart to visualize the momentum.
Examples of RSI Calculation
Imagine a 14-day period where a stock has experienced seven days of gains averaging $2 and seven days of losses averaging $1. The RS would be 2.0. Plugging this into the RSI formula gives an RSI of 66.67, indicating that the stock is not yet overbought, but it is approaching that level.
RSI Interpretation
Understanding RSI Values
The RSI value typically ranges between 0 and 100. A value above 70 indicates that the asset is overbought, while a value below 30 suggests it is oversold. These thresholds can be adjusted depending on market conditions or individual trading strategies.
Overbought and Oversold Conditions
When an asset’s RSI crosses above 70, it signals that the asset may be overbought, and a price correction could be imminent. Conversely, when RSI drops below 30, it suggests that the asset is oversold, potentially indicating a buying opportunity.
Using RSI for Trade Entry and Exit
Traders use RSI to time their entries and exits. For example, they might enter a short position when RSI crosses above 70 or a long position when RSI falls below 30. However, RSI should be used in conjunction with other indicators to avoid false signals.
RSI Settings and Parameters
Default RSI Settings (14-period)
The default setting for RSI is a 14-period calculation, which strikes a balance between sensitivity and reliability. This setting is ideal for most trading scenarios, providing timely signals without too much noise.
Customizing RSI for Different Timeframes
Traders can adjust the RSI period to fit their trading style. A shorter period, such as 7-period RSI, will make the indicator more sensitive, providing more signals but with an increased risk of false positives. Conversely, a longer period, such as 21-period RSI, will smooth out the signals, making them more reliable but less frequent.
Impact of Different Periods on RSI Readings
Changing the RSI period alters the indicator’s sensitivity. A shorter period results in more frequent overbought and oversold signals, which may suit day traders or scalpers. In contrast, longer periods are better suited for swing or position traders looking for more stable signals.
RSI in Various Market Conditions
RSI in Bullish Markets
In a strong uptrend, the RSI often remains above 30 and can even spend extended periods above 70, reflecting sustained buying pressure. Traders might use the 50-level as support during pullbacks.
RSI in Bearish Markets
During a downtrend, RSI frequently stays below 70 and can spend prolonged periods below 30. In such cases, the 50-level often acts as resistance during short-term rallies.
RSI in Sideways/Range-Bound Markets
In a sideways or range-bound market, RSI oscillates more predictably between 30 and 70, making it a useful tool for identifying overbought and oversold levels within the range.
Divergence with RSI
Types of Divergence (Bullish, Bearish)
Divergence occurs when the price of an asset moves in the opposite direction to the RSI. A bullish divergence happens when the price makes a lower low, but RSI forms a higher low, signaling potential upward momentum. A bearish divergence occurs when the price makes a higher high, but RSI forms a lower high, indicating potential downward momentum.
How to Spot Divergence
To spot divergence, compare the price chart with the RSI indicator. Look for instances where the price and RSI move in opposite directions. These divergences can serve as early warnings of potential trend reversals.
Significance of Divergence in Trading Decisions
Divergence is a powerful signal that can help traders anticipate potential reversals. However, it’s essential to confirm these signals with other indicators or price action analysis to avoid false signals.
RSI Trading Strategies
Basic RSI Trading Strategies (Overbought/Oversold)
A common strategy is to buy when RSI crosses below 30 (indicating oversold conditions) and to sell when RSI crosses above 70 (indicating overbought conditions). This simple approach can be effective in range-bound markets.
Combining RSI with Other Indicators (MACD, Moving Averages)
To enhance the reliability of RSI signals, traders often combine RSI with other indicators like MACD (to confirm momentum) or moving averages (to identify trends). For example, a trader might wait for an RSI signal that aligns with a moving average crossover before entering a trade.
Advanced RSI Strategies (RSI + Trendlines)
More advanced traders may use trendlines drawn on the RSI itself, in addition to price charts, to spot breakouts and breakdowns in momentum. This technique can help identify trends that might not be immediately apparent from the price chart alone.
RSI Limitations
False Signals
One of the main drawbacks of RSI is the potential for false signals, especially in volatile markets where the price can swing rapidly without a clear trend.
Challenges in Trending Markets
In strong trending markets, RSI can remain in overbought or oversold territory for extended periods, making it less reliable as a signal for reversals.
Avoiding Pitfalls with RSI
To avoid the pitfalls of RSI, traders should use it in conjunction with other indicators and market analysis techniques. Additionally, it’s essential to be aware of the broader market context when interpreting RSI signals.
H2: RSI in Different Financial Markets
Use of RSI in Stock Markets
In stock markets, RSI is commonly used to identify potential buying opportunities during pullbacks in an uptrend or selling opportunities during rallies in a downtrend.
RSI in Forex Trading
RSI is particularly popular in forex trading, where it helps traders identify potential entry and exit points based on currency pairs’ overbought or oversold conditions.
RSI in Cryptocurrency Markets
In the volatile cryptocurrency markets, RSI can be a useful tool for timing entries and exits. However, traders should be cautious of the increased potential for false signals due to the high volatility.
Case Studies and Real-World Examples
Historical Examples of RSI in Action
Examining past trades where RSI was a key factor can provide valuable insights. For example, a historical analysis of major market corrections often shows RSI dipping below 30, signaling oversold conditions and potential buying opportunities.
Analyzing Famous Trades Using RSI
By studying famous trades where RSI played a critical role, traders can learn how to apply RSI more effectively. For instance, a review of successful trades during the 2008 financial crisis reveals how RSI signals helped traders identify key reversal points.
Lessons Learned from RSI Misinterpretations
Analyzing instances where RSI signals were misinterpreted or led to losses can help traders refine their approach and avoid similar mistakes in the future.
RSI vs Other Indicators
Comparing RSI with MACD
While RSI measures momentum, the MACD focuses on the relationship between two moving averages. Comparing the two can provide a more comprehensive view of market conditions, with RSI offering insights into overbought/oversold levels and MACD providing trend and momentum signals.
RSI vs Stochastic Oscillator
The Stochastic Oscillator is another momentum indicator that compares a security’s closing price to its price range over a specific period. While both RSI and Stochastic Oscillator are used to identify overbought and oversold conditions, they operate on slightly different principles and can complement each other when used together.
RSI vs Moving Averages
RSI and moving averages serve different purposes but can be used together effectively. While RSI helps identify momentum shifts, moving averages smooth out price data to help identify the overall trend, making them a strong combination for trend-following strategies.
RSI as a Complementary Tool
Rather than relying solely on RSI, traders often use it as a complementary tool alongside other indicators. This multifaceted approach can provide a more balanced view of market conditions and improve decision-making.
Advanced RSI Techniques
RSI with Fibonacci Retracements
Combining RSI with Fibonacci retracements can enhance trading strategies. Traders can look for RSI signals at key Fibonacci levels to time entries and exits more precisely.
RSI Bands
Some traders use RSI bands, which are essentially Bollinger Bands applied to the RSI itself. These bands can help identify periods of high volatility and potential breakouts or breakdowns.
Using RSI for Scalping and Day Trading
For scalpers and day traders, RSI can be a valuable tool for identifying quick trading opportunities. By adjusting the RSI period to suit shorter timeframes, traders can gain insights into short-term momentum shifts.
Frequently Asked Questions About RSI
Common Misconceptions About RSI
One common misconception is that RSI always signals an immediate reversal. However, in strong trends, RSI can stay overbought or oversold for an extended period. It’s crucial to understand RSI in the context of the broader market.
How to Use RSI with Other Indicators
RSI is most effective when used alongside other indicators. For example, combining RSI with moving averages or MACD can help filter out false signals and confirm trends.
When to Avoid Using RSI
Traders should be cautious when using RSI in highly volatile or low-liquidity markets, where the risk of false signals is higher. It’s also advisable to avoid relying solely on RSI in strong trending markets, where it can provide misleading signals.
Can RSI Be Used in Long-Term Investing?
While RSI is primarily a tool for short- to medium-term trading, it can also be used in long-term investing to identify periods of extreme overvaluation or undervaluation, which might indicate long-term buying or selling opportunities.
What is the Best RSI Setting?
The best RSI setting depends on the trader’s style and the market being traded. While the default 14-period RSI is commonly used, some traders prefer shorter periods for more sensitivity or longer periods for more reliable signals.
The Relative Strength Index (RSI) is an invaluable tool in technical analysis, offering insights into market momentum and potential reversal points. Whether you’re a novice trader or an experienced analyst, understanding RSI can significantly enhance your trading strategies. By combining RSI with other indicators and maintaining an awareness of its limitations, traders can make more informed decisions and improve their chances of success in the markets.