

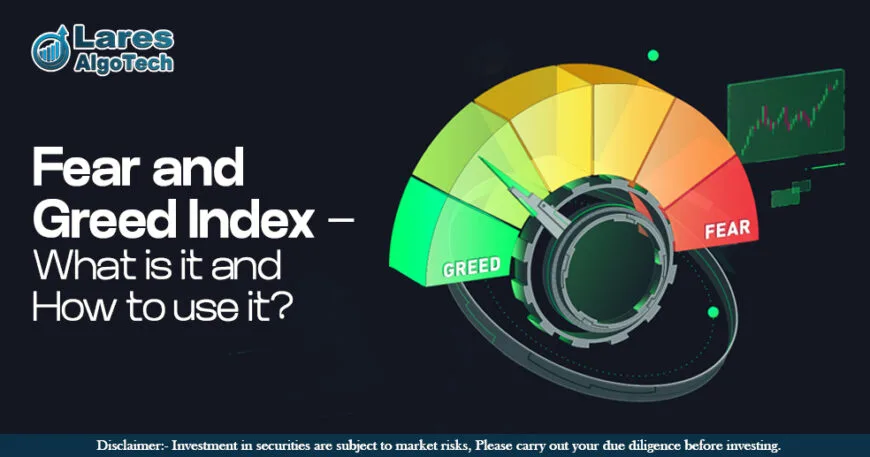
Introduction to the Fear and Greed Index
Financial markets are often viewed as a place where numbers, data, earnings reports, and economic indicators drive investment decisions. While these factors play a significant role, market movements are heavily influenced by human emotions. Every day, millions of investors and traders make decisions based on their expectations, confidence levels, fears, and greed. These emotions can cause stock prices to move sharply, sometimes even more than fundamental business performance would justify.
One of the biggest misconceptions among beginners is that stock markets move only because of company earnings or economic developments. In reality, investor psychology is a major force behind market fluctuations. When investors become optimistic about future growth, they buy aggressively, pushing prices higher. Conversely, when uncertainty increases, investors rush to sell, causing markets to decline rapidly.
This emotional cycle repeats itself throughout market history. During bull markets, greed often dominates. Investors become confident that prices will continue rising, leading to excessive buying. During bear markets, fear takes over, resulting in panic selling and market crashes. Understanding these emotional cycles is essential for successful investing and trading.
This is where the Fear and Greed Index becomes valuable. The Fear and Greed Index is a widely followed market sentiment indicator that measures the emotional state of investors. Instead of focusing solely on price movements, it attempts to quantify whether investors are currently fearful or greedy.
The indicator provides a simple score between 0 and 100. Lower scores indicate fear in the market, while higher scores indicate greed. By monitoring this score, traders and investors can better understand prevailing investor sentiment and make more informed decisions.
Many professional traders use the Fear and Greed Index as a supporting tool to identify potential buying opportunities during periods of fear and potential profit-booking opportunities during periods of excessive optimism. Although it should never be used alone, it offers valuable insights into market psychology and sentiment trends.
As markets become increasingly influenced by news, social media, institutional participation, and algorithmic trading, understanding sentiment indicators such as the Fear and Greed Index has become more important than ever.
What Is the Fear and Greed Index?
The Fear and Greed Index is a sentiment analysis tool designed to measure the emotions driving financial markets. It provides investors with a snapshot of whether market participants are currently acting out of fear or greed.
The primary purpose of the indicator is to help traders understand market psychology. Instead of relying only on technical or fundamental analysis, the Fear and Greed Index examines behavioral patterns that influence investment decisions.
The index gained widespread popularity after being developed by CNN Business. Its goal was to create a simple and easy-to-understand indicator that reflects overall market sentiment. Since then, it has become one of the most widely referenced sentiment indicators among traders, investors, financial analysts, and media outlets.
The Fear and Greed Index operates on a scale ranging from 0 to 100:
Extreme Fear (0–24)
This zone indicates severe pessimism among investors. Market participants become highly risk-averse, often selling assets aggressively. Although prices may decline sharply, extreme fear can sometimes create attractive buying opportunities for long-term investors.
Fear (25–44)
Fear remains dominant, but panic levels are lower than in the Extreme Fear zone. Investors remain cautious, and market sentiment is generally negative.
Neutral (45–55)
The market is relatively balanced. Neither fear nor greed dominates investor behavior. This often occurs when markets are consolidating or awaiting major economic developments.
Greed (56–75)
Optimism increases, and investors become more willing to take risks. Buying activity rises, often driving stock prices higher.
Extreme Greed (76–100)
This zone reflects excessive optimism and euphoria. Investors may ignore risks and continue buying despite high valuations. Historically, prolonged periods of extreme greed have often preceded market corrections.
The popularity of the Fear and Greed Index stems from its simplicity. Investors can quickly determine the emotional condition of the market without analyzing dozens of indicators individually. While it does not predict future price movements, it helps identify periods when emotions may be driving markets to extremes.
Why Market Emotions Matter in Investing
Successful investing is not only about understanding financial statements or economic data. It also requires understanding human behavior. Markets are driven by people, and people are emotional.
Fear and greed are the two most powerful emotions influencing investment decisions. These emotions can cause investors to make irrational choices that often result in losses.
During market crashes, fear dominates. Investors become concerned about losing money and begin selling their holdings. This selling pressure pushes prices even lower, creating a vicious cycle. Many investors sell near market bottoms because fear prevents them from thinking objectively.
The opposite occurs during strong bull markets. Greed encourages investors to chase rising stocks, often buying at inflated prices. Investors become convinced that markets can only move upward, leading to excessive risk-taking.
One major behavioral phenomenon is herd mentality. Rather than conducting independent research, many investors simply follow what everyone else is doing. If the majority is buying, they buy. If the majority is selling, they sell.
Another common emotion-driven behavior is FOMO, or the fear of missing out. When investors see others making profits, they rush into trades without proper analysis. This often leads to poor entry points and disappointing returns.
History provides many examples of emotional investing:
COVID-19 Market Crash (2020)
Global markets plunged as uncertainty surrounding the pandemic spread. Fear reached extreme levels, causing widespread panic selling. However, those who invested during peak fear benefited significantly from the subsequent recovery.
Global Financial Crisis (2008)
Fear dominated financial markets as banking institutions faced unprecedented challenges. Investor confidence collapsed, resulting in one of the largest market declines in modern history.
AI Stock Rally (2024–2025)
Rapid excitement surrounding artificial intelligence drove massive inflows into technology stocks. Investor optimism pushed valuations significantly higher, demonstrating how greed can fuel strong market rallies.
Understanding these emotional patterns helps investors avoid impulsive decisions and maintain discipline during both market highs and lows.
How the Fear and Greed Index Works
The Fear and Greed Index converts various market indicators into a single score ranging from 0 to 100. The purpose is to provide a comprehensive measure of overall investor sentiment.
Fear and Greed Scale
| Score | Meaning |
| 0–24 | Extreme Fear |
| 25–44 | Fear |
| 45–55 | Neutral |
| 56–75 | Greed |
| 76–100 | Extreme Greed |
A score near zero suggests investors are extremely pessimistic, while a score near one hundred indicates excessive optimism.
The index works by collecting and analyzing multiple market data points. Each component measures a different aspect of investor behavior. These components are then assigned weightages and combined to generate a final sentiment score.
The methodology focuses on identifying whether investors are taking on risk or avoiding it. For example, strong demand for stocks typically indicates greed, while increased demand for safe-haven assets such as government bonds often indicates fear.
The calculation process generally follows these steps:
Step 1: Data Collection
Market data is gathered from various sources, including stock prices, trading activity, volatility levels, bond markets, and options markets.
Step 2: Individual Indicator Analysis
Each indicator is evaluated relative to its historical average. This helps determine whether current investor behavior is unusually fearful or unusually greedy.
Step 3: Weightage Assignment
Different indicators receive specific weightages based on their importance in measuring market sentiment. This creates a balanced view of investor psychology.
Step 4: Composite Score Creation
The weighted indicators are combined to generate a single Fear and Greed score between 0 and 100.
The strength of the Fear and Greed Index lies in its ability to summarize complex market behavior into one easy-to-understand number. Instead of monitoring multiple sentiment indicators separately, investors can quickly assess overall market psychology through a single reading.
However, the index should be viewed as a sentiment gauge rather than a prediction tool. Markets can remain fearful or greedy for extended periods. Therefore, traders often combine the Fear and Greed Index with technical analysis, fundamental analysis, and risk management strategies to improve decision-making.
In the next section, we will examine the seven core components that make up the Fear and Greed Index and understand how each contributes to measuring market sentiment.
Components of the Fear and Greed Index
The Fear and Greed Index does not rely on a single market indicator. Instead, it combines multiple data points that reflect investor behavior across different areas of the financial markets. Each component measures a specific aspect of risk appetite, market confidence, or investor caution. Together, these indicators provide a broader picture of market sentiment.
Understanding these components helps traders interpret why the index is moving higher or lower and what it may signal about future market conditions.
5.1 Stock Price Momentum
Stock price momentum measures the strength of the overall market trend. It compares the current performance of the S&P 500 against its historical moving averages, particularly the 125-day moving average.
When the market trades significantly above its moving average, it indicates strong buying activity and increasing optimism. Investors are confident, and greed tends to dominate the market. Such conditions often push the Fear and Greed Index toward the Greed or Extreme Greed zone.
On the other hand, when the market falls below its moving average, it reflects weakness and caution. Investors become less willing to take risks, leading to increased fear.
Momentum is important because strong trends often attract additional buyers. Investors naturally prefer buying assets that are rising in value. However, extremely strong momentum can also indicate overextended markets where a correction becomes increasingly likely.
Professional traders closely monitor momentum because it helps identify whether market sentiment is improving or deteriorating.
5.2 Stock Price Strength
Stock price strength evaluates how many stocks are reaching new 52-week highs compared to those hitting new 52-week lows.
A large number of stocks making new highs indicates broad market strength. It shows that investors are confident across multiple sectors rather than concentrating their investments in only a few companies.
For example, if hundreds of stocks are simultaneously reaching new highs, it suggests widespread optimism and healthy participation in the rally.
Conversely, when many stocks reach new lows, it signals weakness and growing fear among investors. This often occurs during market corrections and bear markets.
Stock price strength helps determine whether a market rally is genuinely supported by broad participation or driven by only a handful of large companies.
5.3 Market Breadth
Market breadth measures the relationship between advancing stocks and declining stocks.
When significantly more stocks are rising than falling, market breadth is considered strong. This indicates widespread buying interest and growing investor confidence.
Strong breadth is generally viewed as a positive sign because it suggests that market gains are supported by a large number of stocks across various sectors.
Weak breadth occurs when declining stocks outnumber advancing stocks. This often reflects growing uncertainty and declining investor sentiment.
Many market experts believe breadth provides one of the clearest pictures of underlying market health because it reveals whether the majority of stocks are participating in a market move.
5.4 Put and Call Options Ratio
The options market offers valuable insights into investor expectations.
Investors purchase call options when they expect prices to rise and put options when they anticipate declines.
The put/call ratio measures the volume of put options relative to call options.
A high put/call ratio suggests investors are buying more protection against falling markets. This indicates fear and caution.
A low put/call ratio indicates investors are aggressively betting on rising prices, reflecting optimism and greed.
Options traders are often considered sophisticated market participants, making this ratio an important sentiment indicator.
Extreme readings in the put/call ratio can sometimes signal potential market reversals because investor positioning may become excessively one-sided.
5.5 Market Volatility (VIX)
Market volatility is commonly measured using the India VIX or the CBOE Volatility Index (VIX) in global markets.
Volatility reflects the expected magnitude of future price fluctuations.
When volatility rises sharply, investors become nervous and uncertain. Market participants demand greater protection, causing volatility indices to increase.
High VIX levels are generally associated with fear because investors expect significant market turbulence.
Low VIX levels typically indicate calm market conditions and greater confidence among investors.
Historically, major market crashes have been accompanied by dramatic spikes in volatility. Therefore, volatility is one of the most reliable indicators of fear in financial markets.
5.6 Safe Haven Demand
During uncertain periods, investors often shift their money from riskier assets into safer investments such as government bonds.
Safe Haven Demand compares the performance of stocks against bonds.
When investors prefer bonds over equities, fear is increasing because market participants prioritize capital preservation.
When investors favor stocks over bonds, confidence improves and greed becomes more dominant.
This component helps identify whether investors are actively seeking safety or embracing risk.
Safe haven demand often rises during geopolitical tensions, economic uncertainty, financial crises, and recession fears.
5.7 Junk Bond Demand
Junk bonds, also known as high-yield bonds, are issued by companies with lower credit ratings.
Because these bonds carry greater risk, investors demand higher returns to hold them.
When investors willingly buy junk bonds, it signals confidence and strong risk appetite. This reflects greed because investors are comfortable accepting higher risk for potentially greater returns.
When demand for junk bonds falls, investors become more cautious and move toward safer investments. This behavior indicates fear.
Junk bond demand is a useful sentiment indicator because it reveals how comfortable investors are with taking financial risks.
When all seven components are combined, they create a comprehensive picture of market psychology. Rather than relying on a single data point, the Fear and Greed Index uses multiple indicators to provide a balanced assessment of overall investor sentiment.
Understanding Extreme Fear vs Extreme Greed
The most important aspect of the Fear and Greed Index is identifying periods of extreme fear and extreme greed. These emotional extremes often create opportunities and risks that traders and investors can use to improve decision-making.
Extreme Fear
Extreme fear occurs when investors become highly pessimistic about future market performance.
During these periods:
- Panic selling increases.
- Market volatility rises.
- Negative news dominates headlines.
- Investors move money into safe assets.
- Stock valuations often become attractive.
Extreme fear usually appears during market crashes, economic recessions, geopolitical tensions, or major financial uncertainties.
While many investors view market declines negatively, contrarian investors often see them as opportunities. When fear dominates, quality stocks may become undervalued because investors focus on short-term concerns rather than long-term fundamentals.
This is one reason why some of the best long-term investment opportunities emerge during periods of extreme fear.
Extreme Greed
Extreme greed occurs when investors become excessively optimistic.
Common characteristics include:
- Aggressive buying activity.
- High market valuations.
- Strong speculative behavior.
- Increased leverage and risk-taking.
- Expectations of continuous market gains.
When greed becomes excessive, investors may ignore warning signs and focus only on positive developments.
This can create asset bubbles where prices rise far beyond their intrinsic value.
History has shown that excessive greed often precedes significant corrections because unrealistic expectations eventually become unsustainable.
Historical Examples
During the 2008 Global Financial Crisis, fear dominated global markets. Investor sentiment reached extremely negative levels as financial institutions struggled and stock markets declined sharply.
Similarly, during the COVID-19 crash in 2020, sentiment collapsed as uncertainty spread worldwide. The Fear and Greed Index entered Extreme Fear territory before markets eventually recovered.
In contrast, technology and AI-related stocks experienced strong optimism during the AI-driven rally of 2024–2025. Investor enthusiasm pushed sentiment toward greed and extreme greed levels as expectations for artificial intelligence growth accelerated.
Understanding these emotional extremes helps investors avoid making decisions based solely on fear or excitement.
How to Read the Fear and Greed Index Correctly
Many beginners misunderstand the Fear and Greed Index by treating it as a direct buy or sell signal. In reality, the indicator is most useful when interpreted as a measure of sentiment rather than a prediction tool.
Daily Interpretation
Daily readings provide a snapshot of current investor emotions.
A sudden shift from neutral to fear may indicate growing uncertainty, while a move toward greed may suggest increasing confidence.
However, one-day changes should not be overemphasized because market sentiment can fluctuate rapidly in response to news events.
Weekly Trends
Weekly sentiment trends often provide more reliable information.
When the index remains in fear territory for several weeks, it indicates sustained caution among investors.
Similarly, several weeks of greed may signal persistent optimism and strong market momentum.
Monitoring weekly trends helps identify meaningful shifts in investor behavior.
Monthly Sentiment Shifts
Longer-term sentiment analysis is particularly valuable for investors.
A gradual movement from extreme fear toward neutral often indicates improving confidence and potential market recovery.
Likewise, a prolonged transition from neutral to extreme greed may suggest increasing speculative activity.
Avoid Overreacting
One of the biggest mistakes traders make is reacting to every short-term change in sentiment.
The Fear and Greed Index should be viewed as part of a broader analysis process rather than a standalone trading system.
Importance of Confirmation
Always confirm sentiment signals using:
- Price action
- Technical indicators
- Market trends
- Volume analysis
- Fundamental research
When sentiment and technical signals align, decision-making becomes more reliable.
Successful traders use the index to understand market psychology while maintaining discipline and following their trading plans.
How Traders Use the Fear and Greed Index
Different types of traders use the Fear and Greed Index in different ways. While the core objective remains understanding market sentiment, the application varies based on trading style and time horizon.
Intraday Traders
Intraday traders focus on short-term market movements.
They monitor sentiment changes to gauge whether market participants are becoming more aggressive or defensive.
Although daily sentiment readings may not generate immediate trading signals, they help traders understand the broader market environment.
For example, trading long positions may be easier during periods of improving sentiment than during periods of widespread fear.
Swing Traders
Swing traders often benefit the most from the Fear and Greed Index.
They use sentiment readings to identify potential reversals and momentum opportunities.
When sentiment reaches extreme fear, swing traders may begin looking for bullish reversal patterns.
When sentiment reaches extreme greed, they may reduce exposure or tighten stop-loss levels.
Options Traders
Options traders closely monitor sentiment because emotions strongly influence volatility.
Periods of fear generally increase option premiums due to rising volatility.
Periods of greed often reduce volatility and option premiums.
Understanding sentiment helps options traders select appropriate strategies and manage risk effectively.
Algo Traders
Modern algorithmic trading systems increasingly incorporate sentiment analysis.
Many advanced strategies combine sentiment indicators with technical indicators, volatility measures, and price action models.
Algo traders can use Fear and Greed readings to adjust risk exposure, position sizing, and strategy selection.
Practical Trading Examples
Buying During Fear
Suppose the Fear and Greed Index falls below 20 and enters Extreme Fear territory.
A trader identifies a fundamentally strong stock that has declined significantly despite healthy business performance.
By combining sentiment analysis with technical support levels, the trader may identify a favorable risk-reward opportunity.
Booking Profits During Greed
Imagine the index rises above 80 and enters extreme greed territory.
Stock prices have rallied strongly, and valuations appear stretched.
Rather than aggressively adding new positions, a trader may choose to book partial profits, rebalance positions, or tighten stop-loss levels.
The Fear and Greed Index does not tell traders exactly when to buy or sell. Instead, it provides valuable context about investor psychology, helping traders make more informed and disciplined decisions.
How Long-Term Investors Use the Fear and Greed Index
While short-term traders use the Fear and Greed Index to identify potential trading opportunities, long-term investors use it differently. Instead of focusing on daily fluctuations, they view the index as a tool for understanding broader market sentiment and making disciplined investment decisions.
SIP Investors
Systematic Investment Plan (SIP) investors generally continue investing regardless of market conditions. However, the Fear and Greed Index can help them understand the current market environment.
During periods of extreme fear, SIP investors may view market declines as opportunities to accumulate more units at lower prices. Since SIPs automatically invest at regular intervals, lower prices often lead to greater wealth creation over the long term.
Value Investors
Value investors actively search for undervalued stocks. When the Fear and Greed Index enters the Fear or Extreme Fear zone, many quality companies may trade below their intrinsic value due to widespread pessimism.
These conditions often create attractive opportunities for investors willing to take a long-term view.
Value investors typically avoid chasing stocks during extreme greed periods because valuations may become stretched and future returns could be limited.
Portfolio Rebalancing
The Fear and Greed Index can also assist in portfolio rebalancing.
When market sentiment becomes excessively optimistic, equity allocations may grow beyond intended targets. Investors can rebalance by booking profits and allocating funds to other asset classes.
Similarly, periods of fear may create opportunities to increase exposure to equities at attractive valuations.
Asset Allocation Decisions
Long-term investors often use sentiment indicators alongside economic and valuation metrics to make asset allocation decisions.
When fear dominates markets, investors may gradually increase equity exposure. When greed becomes excessive, they may adopt a more cautious approach.
One of the most famous investing principles comes from Warren Buffett:
“Be fearful when others are greedy and greedy when others are fearful.”
This philosophy perfectly aligns with the concept of the Fear and Greed Index. Successful long-term investing often involves acting rationally when emotions drive the majority of market participants in the opposite direction.
The key lesson for investors is that sentiment should complement—not replace—fundamental analysis, valuation assessment, and long-term financial planning.
Fear and Greed Index in the Indian Stock Market
Although the original Fear and Greed Index was developed for the U.S. market, its concepts are highly relevant for Indian investors as well.
Indian stock markets experience the same emotional cycles of fear and greed that influence global markets. Investor psychology affects buying decisions, selling pressure, risk appetite, and market participation.
Can Indian Investors Use It?
Yes. Indian investors can use the Fear and Greed Index as a global sentiment indicator while also monitoring domestic factors.
Global market sentiment often influences capital flows, especially because foreign institutional investors play a major role in Indian equity markets.
When global fear rises, Indian markets frequently experience increased volatility.
Relevance for Nifty and Sensex
The Fear and Greed Index can provide valuable context for movements in the Indian market benchmarks such as the NIFTY 50 and the BSE SENSEX.
For example:
- Extreme global fear may trigger selling pressure in Indian equities.
- Extreme greed may support risk-taking and stronger inflows into stocks.
- Positive sentiment can drive rallies across multiple sectors.
Although the index is not directly based on Indian market data, it often reflects the global investment environment that affects domestic markets.
India VIX Relationship
India VIX serves as a useful domestic sentiment indicator.
Rising India VIX levels generally indicate growing uncertainty and fear among market participants.
Declining India VIX levels typically suggest improving confidence and reduced market anxiety.
Role of Foreign Institutional Investors (FIIs)
Foreign Institutional Investors (FIIs) significantly influence Indian markets.
When global sentiment becomes risk-averse, FIIs may reduce exposure to emerging markets, including India.
Conversely, periods of global optimism often result in increased capital inflows into Indian equities.
Therefore, Indian investors can benefit from combining global sentiment indicators such as the Fear and Greed Index with local indicators like India VIX, FII flows, earnings growth, and economic data.
Fear and Greed Index vs India VIX
Many investors confuse the Fear and Greed Index with India VIX because both are associated with market sentiment. However, they measure different aspects of market behavior.
| Fear & Greed Index | India VIX |
| Measures investor sentiment | Measures expected volatility |
| Uses multiple indicators | Uses options market data |
| Provides broader market view | Focuses on future volatility expectations |
| Scale from 0 to 100 | Expressed as volatility percentage |
| Captures fear and optimism | Captures uncertainty and risk |
What Does the Fear and Greed Index Measure?
The Fear and Greed Index combines multiple indicators such as momentum, market breadth, volatility, safe-haven demand, and options activity.
Its purpose is to determine whether investors are primarily driven by fear or greed.
What Does India VIX Measure?
India VIX estimates expected market volatility over the coming weeks.
Higher VIX values suggest greater uncertainty and larger expected market swings.
Lower VIX values indicate calmer market conditions.
When Should Investors Use Each?
The Fear and Greed Index is useful when evaluating overall investor sentiment and identifying emotional extremes.
India VIX is useful when assessing market risk, volatility expectations, and option pricing conditions.
Many professional traders use both indicators together.
For example:
- Fear + Rising VIX = Increased caution.
- Greed + Low VIX = Strong confidence.
- Extreme greed + extremely low VIX = potential complacency.
- Extreme Fear + High VIX = Potential contrarian opportunity.
Combining both indicators provides a more complete understanding of market psychology and risk conditions.
Fear and Greed Index vs Technical Analysis
The Fear and Greed Index measures sentiment, while technical analysis focuses on price behavior and market structure.
Although both approaches are valuable, they serve different purposes.
RSI (Relative Strength Index)
RSI measures momentum and identifies overbought or oversold conditions.
An RSI above 70 often suggests overbought conditions, while an RSI below 30 may indicate oversold conditions.
The Fear and Greed Index focuses on emotions rather than price momentum.
MACD (Moving Average Convergence Divergence)
MACD helps identify trend direction and momentum shifts.
It generates signals based on moving average relationships.
Unlike MACD, the Fear and Greed Index does not directly measure trends.
Moving Averages
Moving averages help traders identify trend direction and support or resistance zones.
They are among the most widely used technical tools.
The Fear and Greed Index complements moving averages by explaining the emotional forces behind market movements.
Volume Analysis
Volume reflects participation and conviction behind price moves.
Strong volume confirms trends, while weak volume may indicate a lack of conviction.
The Fear and Greed Index provides psychological context that volume alone cannot reveal.
Why Use Both Together?
Sentiment indicators and technical indicators work best when used together.
For example:
- Extreme Fear + Bullish RSI Divergence = Potential buying opportunity.
- Extreme Greed + Bearish MACD Signal = Potential warning sign.
- Strong Trend + Improving Sentiment = Trend Continuation Possibility.
By combining sentiment and technical analysis, traders gain a more complete understanding of market conditions and improve decision-making quality.
Common Mistakes Traders Make
The Fear and Greed Index is a useful tool, but many traders misuse it. Understanding common mistakes can help investors avoid costly errors.
Mistake 1: Using It as a Direct Buy or Sell Signal
One of the biggest misconceptions is treating the index as an automatic trading system.
Extreme fear does not guarantee a market bottom, and extreme greed does not guarantee a market top.
Markets can remain in extreme conditions for extended periods.
Mistake 2: Ignoring Fundamentals
Sentiment is only one piece of the puzzle.
Strong companies can continue performing well even during fearful markets, while weak companies may struggle despite positive sentiment.
Fundamental analysis remains essential.
Mistake 3: Following Crowd Sentiment Blindly
Many traders become overly influenced by prevailing market emotions.
Successful investing often requires independent thinking rather than blindly following the crowd.
Mistake 4: Ignoring Risk Management
Even when sentiment appears favorable, every trade carries risk.
Stop-loss orders, position sizing, diversification, and disciplined portfolio management remain critical.
The Fear and Greed Index should support a strategy—not replace sound risk management practices.
Advantages of Using the Fear and Greed Index
The Fear and Greed Index has become one of the most popular sentiment indicators because of its simplicity and practical value.
Easy to Understand
Unlike many complex market indicators, the Fear and Greed Index presents sentiment in a simple numerical format.
Investors can quickly understand whether fear or greed currently dominates the market.
Helps Identify Market Sentiment
The index provides insight into the emotional state of investors.
Understanding sentiment can help investors avoid making emotionally driven decisions.
Useful for Timing Entries
Periods of extreme fear often coincide with attractive long-term opportunities.
Similarly, periods of extreme greed may encourage investors to review profits and reduce excessive risk exposure.
Supports Contrarian Strategies
Many successful investors adopt contrarian approaches.
The Fear and Greed Index helps identify situations where market emotions may have pushed prices away from their intrinsic values.
Helps Reduce Emotional Decision-Making
Markets are heavily influenced by psychology.
The index encourages investors to objectively evaluate sentiment rather than reacting impulsively to news headlines or short-term price movements.
When combined with technical analysis, fundamental research, and disciplined risk management, the Fear and Greed Index can become a valuable addition to an investor’s decision-making toolkit.
Limitations of the Fear and Greed Index
While the Fear and Greed Index is a valuable market sentiment indicator, it is important to understand its limitations. No indicator can accurately predict market movements all the time, and relying solely on sentiment can lead to poor investment decisions.
It Is Not a Predictive Tool
One of the biggest limitations is that the Fear and Greed Index does not predict future market direction. It simply measures current investor sentiment.
For example, a market showing extreme fear today may continue falling for several weeks. Similarly, a market in Extreme Greed territory may continue rallying longer than expected.
Therefore, investors should avoid assuming that extreme readings automatically signal immediate reversals.
Extreme Conditions Can Persist
Markets often remain fearful or greedy for extended periods.
During strong bull markets, greed can dominate for months. Likewise, prolonged bear markets can keep sentiment depressed for a long time.
Many traders lose money by entering positions too early based solely on sentiment readings.
Does Not Replace Research
The Fear and Greed Index cannot evaluate company earnings, economic conditions, interest rates, corporate governance, or industry trends.
Fundamental analysis remains essential for selecting quality investments.
Not Suitable as a Standalone Strategy
Professional investors rarely rely on a single indicator.
The Fear and Greed Index works best when combined with:
- Technical Analysis
- Fundamental Analysis
- Market Trends
- Risk Management Rules
- Economic Indicators
Using it in isolation can result in incomplete decision-making.
Limited Coverage
The original index was designed primarily for U.S. markets. Although its concepts apply globally, local market conditions may not always align perfectly with global sentiment readings.
For Indian investors, combining sentiment analysis with domestic indicators such as India VIX, FII flows, and earnings data often provides better insights.
Understanding these limitations helps investors use the Fear and Greed Index responsibly and effectively.
Best Strategy for Using the Fear and Greed Index
The most effective way to use the Fear and Greed Index is as part of a structured trading and investing framework. Rather than treating it as a standalone signal, investors should integrate it into a broader decision-making process.
Step 1: Check Market Sentiment
Start by reviewing the current Fear and Greed Index reading.
- 0–24 = Extreme Fear
- 25–44 = Fear
- 45–55 = Neutral
- 56–75 = Greed
- 76–100 = Extreme Greed
This provides a quick snapshot of overall investor psychology.
Step 2: Analyze the Trend
After identifying sentiment, evaluate the market trend.
Questions to consider:
- Is the market in an uptrend?
- Is the market in a correction?
- Is volatility increasing?
- Are major indices above key moving averages?
Trend analysis helps determine whether sentiment aligns with price action.
Step 3: Confirm with Technical Indicators
Before entering a trade, confirm signals using technical tools.
Useful indicators include:
- RSI
- MACD
- Moving Averages
- Support and Resistance Levels
- Volume Analysis
For example, extreme fear combined with bullish technical signals often provides stronger opportunities than sentiment alone.
Step 4: Review Fundamentals
Investors should always examine:
- Company earnings
- Revenue growth
- Debt levels
- Industry outlook
- Economic conditions
A stock may appear attractive during fearful markets, but poor fundamentals can still create significant risks.
Step 5: Apply Risk Management
Risk management remains the foundation of successful investing.
Key principles include the following:
- Position sizing
- Stop-loss placement
- Diversification
- Portfolio allocation
- Profit booking rules
Complete Workflow Example
- The Fear and Greed Index enters Extreme Fear.
- Market approaches major support levels.
- RSI indicates oversold conditions.
- Strong fundamentally sound companies become undervalued.
- Investor gradually accumulates positions.
- Risk is controlled through proper position sizing.
Similarly, during Extreme Greed:
- Sentiment becomes highly optimistic.
- Valuations appear stretched.
- Technical indicators show weakening momentum.
- Investor books partial profits.
- Portfolio is rebalanced.
This systematic approach reduces emotional decision-making and improves long-term consistency.
Real-World Examples of Fear and Greed Index Signals
Historical market events demonstrate how shifts in investor sentiment influence asset prices and create opportunities for disciplined investors.
Example 1: COVID Market Crash (2020)
The COVID-19 pandemic created one of the fastest market crashes in history.
As uncertainty spread globally:
- Fear surged dramatically.
- Volatility spiked.
- Investors rushed to safe assets.
- Equity markets experienced sharp declines.
The Fear and Greed Index entered Extreme Fear territory as panic dominated financial markets.
However, investors who remained disciplined and focused on long-term fundamentals were rewarded when markets recovered strongly in the following months.
This event highlighted how fear can create opportunities for patient investors.
Example 2: AI Bull Run (2024–2025)
Artificial intelligence became one of the most influential investment themes of the decade.
Investor enthusiasm surrounding AI-driven businesses pushed technology stocks significantly higher.
Characteristics included:
- Rapid price appreciation
- Strong retail participation
- Increased media attention
- Optimistic growth expectations
Sentiment frequently moved toward greed and extreme greed as investors anticipated substantial future growth.
While many companies benefited from genuine innovation, some stocks experienced excessive speculation, illustrating the risks associated with euphoric market conditions.
Example 3: Major Market Corrections
Throughout history, significant corrections have often been preceded by elevated optimism.
Examples include:
- Dot-com bubble
- Housing market boom before 2008
- Various speculative rallies across asset classes
In many cases, investor confidence became excessive before markets eventually corrected.
The Fear and Greed Index helps investors recognize when emotions may be driving valuations beyond reasonable levels.
The key lesson from these examples is that sentiment extremes often coincide with important turning points, although timing those turning points remains difficult.
Future of Sentiment Analysis in Trading
Sentiment analysis is evolving rapidly as technology transforms financial markets.
Traditional indicators such as the Fear and Greed Index remain valuable, but new tools are expanding how investor emotions are measured.
AI-Powered Sentiment Tracking
Artificial Intelligence can analyze millions of news articles, earnings reports, analyst comments, and financial publications in real time.
This enables faster and more comprehensive sentiment assessment.
Social Media Sentiment
Platforms such as X, Reddit, YouTube, and financial communities increasingly influence market behavior.
Advanced sentiment engines now monitor social media conversations to identify emerging trends and investor reactions.
Machine Learning Models
Machine learning algorithms can recognize patterns in sentiment data that may not be visible through traditional analysis.
These models continuously improve as more market data becomes available.
Algorithmic Trading Applications
Many modern trading systems incorporate sentiment analysis alongside technical and quantitative signals.
At companies such as Lares Algotech, advanced trading technology increasingly combines market data, technical indicators, and sentiment insights to support smarter decision-making.
As AI capabilities continue to advance, sentiment analysis is expected to become an even more important component of modern investing and trading strategies.
Conclusion
The Fear and Greed Index is one of the most widely followed market sentiment indicators because it provides a simple yet powerful way to understand investor psychology.
Financial markets are driven not only by earnings, economic data, and business fundamentals but also by human emotions. Fear can cause panic selling and market crashes, while greed can fuel rallies, speculation, and asset bubbles.
By measuring these emotions, the Fear and Greed Index helps investors identify periods when sentiment may be excessively pessimistic or overly optimistic.
However, the indicator should never be viewed as a standalone trading system. Successful investors combine sentiment analysis with:
- Technical Analysis
- Fundamental Analysis
- Market Trends
- Economic Data
- Risk Management
Periods of extreme fear may reveal attractive long-term opportunities, while periods of extreme greed may encourage investors to review risk exposure and portfolio allocations.
Whether you are an intraday trader, swing trader, options trader, algo trader, or long-term investor, understanding market sentiment can significantly improve decision-making.
For traders using advanced platforms and analytical tools such as those offered by Lares Algotech, the Fear and Greed Index can serve as an additional layer of market intelligence that complements technical indicators and quantitative analysis.
Ultimately, successful investing is not about eliminating emotions from the market—it is about understanding them better than the crowd and making rational decisions when others are driven by fear or greed.
FAQs
What is the Fear and Greed Index in the stock market?
The Fear and Greed Index is a market sentiment indicator that measures whether investors are currently driven by fear or greed. It uses multiple market indicators to generate a score between 0 and 100.
What does “extreme fear” mean?
Extreme fear indicates that investors are highly pessimistic and risk-averse. While markets may be under pressure, such periods can sometimes create attractive long-term investment opportunities.
What does extreme greed indicate?
Extreme greed suggests excessive optimism and strong risk-taking behavior. Historically, prolonged periods of extreme greed have often preceded market corrections.
Is the Fear and Greed Index accurate?
The index is useful for measuring investor sentiment but should not be used as a standalone predictive tool. It works best alongside technical and fundamental analysis.
Can Indian investors use the Fear and Greed Index?
Yes. Indian investors can use it to understand global sentiment while combining it with domestic indicators such as India VIX, FII activity, and movements in the NIFTY 50 and BSE SENSEX.
How often is the Fear and Greed Index updated?
Most versions of the index are updated daily based on changes in market data and sentiment indicators.
Is the Fear and Greed Index useful for long-term investors?
Yes. Long-term investors often use it to identify periods of excessive fear or greed and make more disciplined investment decisions.
What is the difference between the Fear and Greed Index and the India VIX?
The Fear and Greed Index measures overall investor sentiment, while India VIX measures expected market volatility.
Can traders use the Fear and Greed Index for intraday trading?
Yes, but it should be used as a sentiment indicator rather than a direct buy or sell signal.
What is the best way to use the Fear and Greed Index?
Lares Algotech’s approach is to combine sentiment analysis with technical indicators, fundamentals, market trends, and proper risk management.