
Introduction
A sharp price movement can change a trading chart within minutes. A stock may rise quickly after consolidation, or an index may fall through several price levels during a sudden sell-off. These movements sometimes create a pattern known as a fair value gap, or FVG.
Understanding FVG in trading helps traders identify specific price areas left behind by rapid market movements. Some traders monitor these zones when prices return, looking for possible support, resistance, or continuation signals.
However, identifying a fair value gap does not reveal what price will do next. The pattern becomes more useful when traders understand its formation, examine the surrounding market structure, and apply clearly defined risk controls.
This guide explains the fair value gap meaning, bullish and bearish formations, practical examples, and how to identify fair value gaps on trading charts.
What Is a Fair Value Gap in Trading?
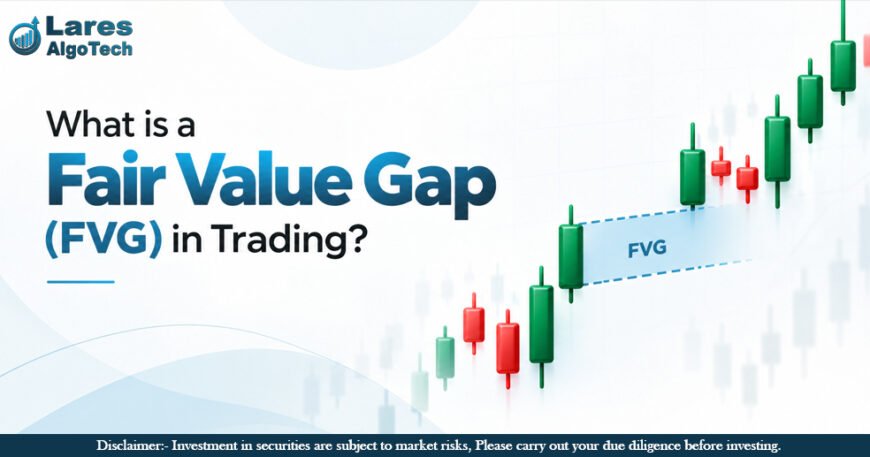
A fair value gap is a three-candle price pattern in which the price ranges of the first and third candles do not overlap, typically following a strong directional movement through the middle candle.
The space between the relevant wicks of the first and third candles defines the FVG zone.
For example, consider an upward movement:
- The first candle reaches a high of ₹1,000.
- The second candle moves sharply higher.
- The third candle has a low of ₹1,010.
The area between ₹1,000 and ₹1,010 forms a bullish fair value gap.
An important distinction is that the middle candle may have traded through this entire area. Therefore, an FVG does not automatically mean that no transactions occurred within the zone.
The observable feature is the absence of price-range overlap between the first and third candles.
Understanding the Fair Value Gap Meaning
The phrase “fair value” can sound like a valuation measure. In this context, it does not represent a company’s intrinsic value, a stock’s correct market price, or an analyst’s price target.
Instead, it belongs to a price-action framework used to interpret rapid market movements.
Traders commonly describe an FVG as a price imbalance. This interpretation suggests that price moved quickly through an area without much back-and-forth movement.
However, ordinary candlestick data cannot establish how many unfilled orders remain within that area. It also cannot confirm whether institutional participants intend to buy or sell there.
A practical understanding is
A fair value gap identifies a specific chart structure. Its presence alone does not establish a profitable trading opportunity.
How Does a Fair Value Gap Form?
A fair value gap develops across three consecutive candles.
Candle 1: Before the Main Movement
The first candle provides the initial reference range. Its high or low becomes one boundary of the potential gap.
Candle 2: The Directional Movement
The middle candle usually shows a strong upward or downward move. Traders often call this displacement because price moves noticeably away from the preceding trading area.
Candle 3: Completion of the Pattern
The third candle determines whether the required separation remains.
For a bullish formation, its low must stay above the first candle’s high. For a bearish formation, its high must remain below the first candle’s low.
Such patterns may appear during breakouts, news reactions, or other periods of rapid repricing. However, the candle pattern alone cannot reliably identify the cause.
A large middle candle is also insufficient by itself. If the outer candles overlap, the standard FVG condition is absent.
What Is a Bullish Fair Value Gap?
A bullish fair value gap forms when the third candle’s low is higher than the first candle’s high.
The identification rule is
Candle 3 low > Candle 1 high
The zone extends from Candle 1’s high to Candle 3’s low.
Bullish Fair Value Gap Example
Consider the following hypothetical candle ranges:
| Candle | High | Low | Role |
| Candle 1 | ₹1,000 | ₹985 | Before the upward movement |
| Candle 2 | ₹1,025 | ₹992 | Strong upward movement |
| Candle 3 | ₹1,032 | ₹1,010 | Completes the formation |
Here:
Fair value gap width = ₹1,010 − ₹1,000 = ₹10
The bullish FVG lies between ₹1,000 and ₹1,010.
If the price later declines into this area, traders may observe whether it stabilizes and moves higher.
However, the price can also continue falling through the entire zone. The bullish label describes the formation’s direction, not a guaranteed future outcome.
What Is a Bearish Fair Value Gap?
A bearish fair value gap forms when the third candle’s high is lower than the first candle’s low.
The identification rule is
Candle 3 high < Candle 1 low
The zone extends from Candle 3’s high to Candle 1’s low.
Bearish Fair Value Gap Example
Consider another hypothetical sequence:
| Candle | High | Low | Role |
| Candle 1 | ₹1,020 | ₹1,000 | Before the downward movement |
| Candle 2 | ₹1,008 | ₹975 | Strong downward movement |
| Candle 3 | ₹990 | ₹970 | Completes the formation |
The calculation is:
Fair value gap width = ₹1,000 − ₹990 = ₹10
The bearish FVG lies between ₹990 and ₹1,000.
If the price subsequently rises into this area, traders may watch for a possible resistance response. Nevertheless, the price can move above the zone, making the anticipated bearish reaction unsuccessful.
How to Identify Fair Value Gaps on Trading Charts
A consistent process reduces confusion and helps prevent hindsight-based analysis.
Select a Timeframe
Begin with a defined chart interval, such as five minutes, fifteen minutes, or one hour.
All three candles must belong to the same timeframe. Combining prices from different intervals does not produce the standard three-candle pattern.
Use ordinary candlesticks when learning. Alternative chart types may transform price information and change the formations you see.
Look for a Directional Move
Find a clear upward or downward movement through the middle candle.
If your method requires unusually strong displacement, define that condition objectively. For example, you could compare the middle candle’s body with the average body size of recent candles.
This would be an additional research filter rather than a universal FVG rule.
Compare the Outer Wicks
For a bullish formation, compare Candle 1’s high with Candle 3’s low.
For a bearish formation, compare Candle 1’s low with Candle 3’s high.
Include the wicks. Looking only at candle bodies may produce zones that do not satisfy the standard wick-based definition.
If the relevant boundaries touch, there is no positive-width gap.
Wait for the Third Candle to Close
An apparent gap can disappear while Candle 3 is forming.
For instance, its low may initially remain above Candle 1’s high. A later downward wick could remove that separation.
Waiting for the candle to close confirms the pattern’s existence on the selected timeframe. It does not confirm a future price reaction.
Mark the Boundaries
Draw a rectangle between the relevant prices and extend it forward.
Record the formation time, timeframe, and original boundaries. Avoid moving the rectangle afterwards to make a subsequent reaction appear more accurate.
Examine Market Context
Review nearby swing highs, swing lows, support, and resistance.
Determine whether the market is trending or moving sideways. Context helps frame a trading hypothesis, but any claimed improvement in performance requires testing.
Bullish vs Bearish Fair Value Gaps
| Feature | Bullish FVG | Bearish FVG |
| Associated movement | Upward | Downward |
| Identification | Candle 3 low exceeds Candle 1 high. | Candle 3 high falls below. Candle 1 low |
| Lower boundary | Candle 1 high | Candle 3 high |
| Upper boundary | Candle 3 low | Candle 1 low |
| Common observation on a revisit | Possible support response | Possible resistance response |
| Main limitation | Price can continue below the zone. | Price can continue above the zone. |
Neither formation guarantees continuation in its original direction.
What Happens When Price Revisits an FVG?
Several outcomes are possible.
Partial Entry
Price enters the zone but turns before reaching the opposite boundary.
This is different from a full traversal and should be recorded separately when reviewing historical examples.
Midpoint Visit
The price reaches the center of the zone. Some trading frameworks call this midpoint “consequent encroachment.”
For a gap between ₹1,000 and ₹1,010:
Midpoint = (₹1,000 + ₹1,010) ÷ 2 = ₹1,005
Reaching the midpoint does not guarantee a reversal.
Full Traversal
Price moves through the entire zone. Depending on the method, traders may describe this as a full fill or consider it part of an invalidation condition.
No Revisit
The price continues to be paid away without returning during the observation period.
These different outcomes show why traders must define terms such as “touch,” “fill,” and “invalidation” before assessing results.
Do Fair Value Gaps Always Get Filled?
No. There is no rule requiring the price to revisit every fair value gap.
A zone can remain untouched throughout a trading session or beyond the trader’s intended holding period.
Even an eventual revisit does not prove that waiting for the gap to fill would have produced a practical trade.
Any claim about gap-fill frequency needs clear definitions covering:
- The instrument and timeframe.
- The pattern-selection rules.
- What qualifies as a fill.
- The maximum observation period.
- How overlapping formations are counted.
A high fill rate also does not automatically mean profitability. Entries, exits, losses, and execution costs determine the financial outcome.
Fair Value Gap vs. a Regular Price Gap
A regular price gap involves separation between consecutive candles.
For example, a gap up occurs when the current candle’s low is above the previous candle’s high.
An FVG compares the first and third candles across a three-candle sequence.
| Aspect | Fair Value Gap | Regular Price Gap |
| Main comparison | First and third candles | Consecutive candles |
| Structure | Three-candle formation | Separation between adjacent ranges |
| Trading within the area | The middle candle may trade through it | The gap separates adjacent candle ranges |
| Requires a new session? | No | No |
This distinction helps avoid the incorrect assumption that every FVG represents an entirely untraded price area.
How Traders Evaluate an FVG
Market Structure
Compare the formation with recent swing points.
Is the market producing higher highs and higher lows, or moving in a downward sequence? Does the formation appear within a range?
Trend alignment can be part of a method, but its usefulness should be measured rather than assumed.
Location
Examine whether the gap sits near an established price level or within a crowded trading range.
Several overlapping technical signals do not necessarily provide independent confirmation. They may describe the same underlying movement.
Price Reaction
Some methods act when price first reaches a boundary. Others wait for a completed reaction candle or another defined event.
These approaches produce different entry prices, missed trades and loss profiles. Neither is universally superior.
Execution Conditions
Check spreads, liquidity and trading costs.
A small expected price movement may leave little room after expenses. In derivatives, leverage and contract specifications also affect risk.
Risk Management When Studying FVG Setups
A marked rectangle does not control losses. A complete trading approach needs defined entry conditions, invalidation rules, position sizing and exits.
Consider a hypothetical cash-equity example:
- Planned entry: ₹1,008.
- Planned stop: ₹998.
- Planned price risk: ₹10 per share.
- Position size: 50 shares.
The planned price loss would be ₹500, excluding charges and execution differences.
Actual losses can exceed this estimate if the market gaps or the exit executes at a worse price.
Stop placement should reflect the tested trading hypothesis. Placing a stop immediately outside a gap simply because the rectangle ends there may lack analytical justification.
Common Mistakes When Identifying Fair Value Gaps
Marking every large candle: Candle size alone does not establish the required outer-candle separation.
Ignoring wicks: Body-only comparisons can identify a different structure.
Acting before formation completes: The third candle can still remove the apparent gap.
Assuming institutional activity: Candlesticks do not identify the participants behind transactions.
Expecting guaranteed support or resistance: Price can move through any marked zone.
Redrawing after the outcome: Changing boundaries introduces hindsight bias.
Confusing detection with validation: An indicator can identify a pattern correctly without demonstrating a profitable strategy.
How to Practise FVG Identification
Start with one instrument and timeframe. Write your identification rules before reviewing historical charts.
Record every qualifying formation during a defined period, including unsuccessful examples and gaps that receive no revisit.
For each formation, note its boundaries, creation time, market context and subsequent price behaviour.
If testing a trading strategy, define entry and exit rules separately from pattern detection. Include costs and realistic execution assumptions.
Historical candles also have limitations. If both a stop and target fall within one candle’s range, the candle may not reveal which occurred first.
Use finer data where available or apply a conservative, consistent assumption. Finally, assess the rules on a separate period to reduce the risk of fitting them only to familiar historical examples.
FAQ’s
What does FVG mean in trading?
FVG stands for fair value gap. It describes a three-candle formation where the first and third candles have non-overlapping price ranges around a directional move.
Must all three candles have the same colour?
No. The basic definition compares highs and lows. Requiring matching candle colours is an additional filter.
Which timeframe is best for fair value gaps?
There is no universally best timeframe. Choose an interval suited to the intended holding period and test it consistently.
Does an FVG prove that orders remain unfilled?
No. Candlestick information alone cannot establish the quantity or location of outstanding orders.
Can beginners identify fair value gaps manually?
Yes. Compare the relevant outer-candle highs and lows, wait for Candle 3 to close, and mark the boundaries.
Is an FVG enough to make a trading decision?
The pattern alone does not establish a trading edge. A complete method needs execution rules, risk controls and evidence from testing.
Conclusion
Understanding how to identify fair value gaps begins with a precise three-candle comparison. A bullish fair value gap forms when Candle 3’s low exceeds Candle 1’s high. A bearish fair value gap forms when Candle 3’s high falls below Candle 1’s low.
Their practical usefulness depends on what happens after identification and whether a clearly defined approach survives realistic testing. Treat FVGs as observable chart structures, understand their limitations, and keep risk management central to the process.
This article is for educational purposes and does not constitute an investment recommendation.