
Introduction
When traders look at a stock chart, price is usually the first thing they notice. They want to know whether the stock is rising, falling, or moving sideways. But price alone does not always explain what is happening behind a market move. This is where volume in stock market analysis becomes useful.
Trading volume shows the amount of trading activity taking place in a security during a specified period. It can help traders understand how much market participation exists behind a price movement.
For example, imagine that a stock moves above an important resistance level. If the move happens with significantly higher trading volume than usual, traders may view the breakout differently from one occurring with very little activity. Volume does not guarantee that the breakout will continue, but it provides another piece of information for evaluating the move.
For beginners, learning how to read trading volume can improve their understanding of price action, trends, breakouts, liquidity, and market participation.
However, volume should not be treated as a standalone buy or sell signal. It works best when considered alongside price action, market structure, volatility, support and resistance, broader market conditions, and proper risk management.
This guide explains what volume is in the stock market, how it works, why traders monitor it, and how price and volume can be studied together.
What Is Volume in the Stock Market?
Volume in the stock market refers to the quantity of shares, contracts, or other securities traded during a particular period.
For equity shares, it generally tells you how many shares changed hands during the period being measured. Exchange market statistics can report volume in shares or contracts depending on the instrument.
Suppose Company XYZ records a trading volume of 800,000 shares during a trading session. This means 8 lakh shares were traded during that session.
Volume can be measured across different timeframes, including:
- One minute
- Five minutes
- Fifteen minutes
- One hour
- One trading session
- One week
- One month
Therefore, the meaning of a volume number depends on the chart timeframe being analyzed.
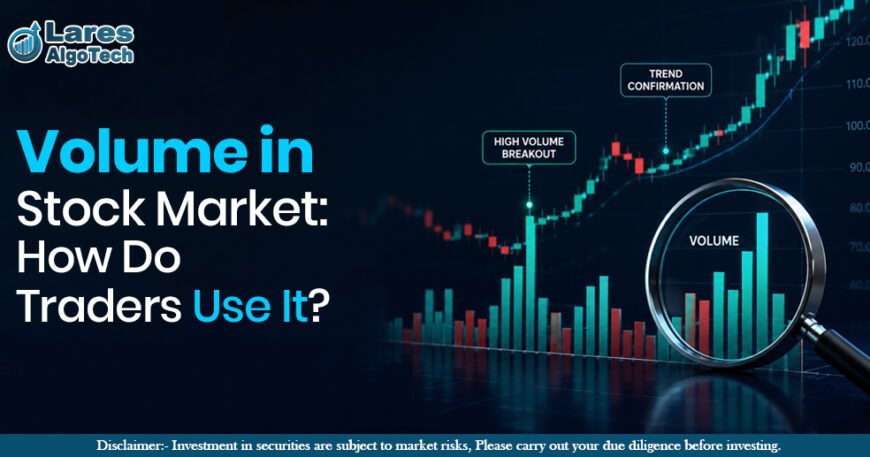
On most stock charts, volume appears as vertical bars underneath the price chart. A taller bar represents greater trading activity for that period, while a shorter bar represents comparatively lower activity.
An important distinction is that volume is not the same as the number of traders. One large market participant can account for a substantial quantity of shares, while many smaller traders can collectively generate similar volume.
How Does Trading Volume Work?
Every completed market transaction involves a buyer and a seller.
Suppose one market participant sells 100 shares and another participant purchases those 100 shares. The transaction contributes 100 shares to traded volume—not 200 simply because two parties participated.
As transactions continue throughout the session, cumulative daily volume increases.
Trading activity is not necessarily constant throughout the day. Volume may change due to factors such as:
- Market opening activity
- Major price movements
- Company announcements
- Corporate results
- Sector-specific developments
- Economic data
- Broader market volatility
- Institutional activity
- Unexpected news
As a result, traders usually do not interpret a volume number in isolation. They compare it with the stock’s normal or historical trading activity.
A volume of 10 lakh shares, for example, may be unusually large for one company but completely normal for another.
Why Is Volume Important in Trading?
Volume provides traders with additional context about market participation.
Think of price as showing what happened, while volume can help indicate how much trading activity accompanied what happened.
This makes volume particularly useful when studying trends, breakouts, support and resistance, liquidity, and unusual market activity.
Measuring Market Participation
When volume increases significantly, more shares or contracts are changing hands.
This can indicate increased interest or activity in a security.
However, traders should not automatically assume the following:
High volume = buying
Every completed transaction has both a buyer and a seller. The more relevant question is how price behaves while that volume is occurring.
Confirming Price Movements
Traders frequently compare changes in price with changes in volume.
For example, suppose a stock has been trading between ₹480 and ₹500 for several sessions.
It eventually moves above ₹500.
A trader may ask:
- How much volume accompanied the breakout?
- Is current volume higher than recent sessions?
- Did the stock close above resistance?
- Is the move sustained?
- Is there relevant news behind the movement?
Volume becomes one part of a broader confirmation process.
Understanding Liquidity
Trading volume can also provide useful information about liquidity.
SEBI materials note that the ability to execute or sell listed securities can be affected by overall trading volume and broader market liquidity.
However, volume and liquidity should not be considered identical. Bid-ask spreads, market depth, order size, and prevailing market conditions also matter.
Price and Volume: Understanding Their Relationship
One of the most useful ways to understand volume analysis in trading is to study price and volume together.
Here are four commonly observed combinations.
| Price Movement | Volume Movement | What Traders May Examine |
| Price rising | Volume rising | Increasing participation in upward move |
| Price rising | Volume falling | Whether participation behind the rise is weakening |
| Price falling | Volume rising | Increasing activity during selling |
| Price falling | Volume falling | Whether participation in the decline is reducing |
These relationships are interpretive frameworks rather than guaranteed trading signals.
Let’s understand each situation.
Price Rising + Volume Rising
Suppose a stock rises from ₹800 to ₹850 while trading volume also expands substantially.
This means the upward price movement is occurring alongside increased market activity.
Many technical traders interpret this as stronger participation behind the move.
But it does not mean that the stock must continue rising. News, valuations, broader market conditions, and sudden changes in sentiment can reverse a move quickly.
Price Rising + Volume Falling
Now suppose a stock keeps moving upward, but trading volume gradually declines.
A trader may investigate whether fewer market participants are participating in the move.
It does not automatically mean that the stock will fall.
Instead, it may prompt the trader to look for additional confirmation.
Price Falling + Volume Rising
If a stock falls sharply while volume expands, it indicates substantial trading activity during the decline.
This can happen during:
- Negative corporate news
- Earnings disappointments
- Market corrections
- Sector weakness
- Profit booking
- Broader risk-off periods
Traders may study whether important support levels are also being broken.
Price Falling + Volume Falling
A falling stock accompanied by declining volume may indicate that trading participation in the downward move is decreasing.
Again, that doesn’t automatically signal a reversal.
The existing trend can continue even with reduced volume.
How Do Traders Use Volume in the Stock Market?
Understanding how traders use volume requires looking beyond individual volume bars.
Professional and experienced traders generally analyze volume within the context of price structure.
Here are some common applications.
Using Volume to Confirm Trends
Suppose a stock has been moving upward for several weeks.
Instead of simply observing that the price is rising, a trader may study the following:
- Volume during upward sessions
- Volume during pullbacks
- Average trading volume
- Price structure
- Previous highs
- Support levels
If strong price advances repeatedly occur alongside healthy participation, traders may consider the trend to have stronger participation.
But volume is only one factor. Trends can change suddenly.
Using Volume to Study Breakouts
Breakout analysis is one of the most common applications of stock market volume.
A breakout occurs when a price moves beyond an important technical level, such as:
- Previous high
- Resistance zone
- Consolidation range
- Chart pattern boundary
Imagine a stock repeatedly faces resistance near ₹1,000.
Its recent daily volume averages around 4 lakh shares.
One day, the stock moves to ₹1,030 while volume rises to 10 lakh shares.
A trader may consider the increased volume meaningful because market activity expanded as price crossed resistance.
The trader would still need to consider whether the price sustains above ₹1,000.
A high-volume breakout can fail. Therefore, volume should improve the quality of analysis rather than replace risk management.
Identifying Potential False Breakouts
A stock may temporarily move above resistance and then quickly return below it.
This is commonly called a false breakout.
Suppose resistance is ₹750.
The stock briefly trades at ₹758 but finishes the session at ₹744.
If the move above resistance also occurred without meaningful volume expansion, some traders may be less convinced by the breakout.
However, low volume alone cannot establish that a breakout is false.
Traders may also examine:
- Closing price
- Candlestick structure
- Follow-through
- Overall trend
- Market conditions
- Relevant news
- Volatility
What Is High Volume in Stocks?
There is no single number that defines high trading volume for every stock.
High volume is relative.
Suppose Stock A normally trades around 50,000 shares per day. If it suddenly trades 3 lakh shares, that may represent a major increase.
Stock B, however, might normally trade 50 lakh shares every day. Three lakh shares would not be high for that stock.
This is why traders often compare today’s volume against the following:
- Previous day’s volume
- 10-day average
- 20-day average
- 50-day average
- Typical volume for the same trading period
The comparison provides more context than the absolute number.
What Is Low Volume in the Stock Market?
Low volume means relatively fewer shares or contracts are being traded compared with normal activity for that security or period.
Low trading volume can sometimes be associated with:
- Reduced market participation
- Lower trader interest
- Quiet market conditions
- Consolidation
- Lower liquidity
For less liquid securities, traders may also encounter wider bid-ask spreads or difficulty executing larger orders near the expected market price.
SEBI materials highlight liquidity as an important consideration and note that investors should understand the risks associated with volatile or illiquid investments.
This is particularly important for traders who need to enter and exit positions quickly.
Volume vs. Liquidity: What’s the Difference?
Volume and liquidity are related concepts, but they are not exactly the same.
Trading Volume
Volume measures the quantity of shares or contracts traded during a specified period.
Liquidity
Liquidity refers more broadly to how easily an asset can be bought or sold without causing a substantial adverse price impact.
A trader evaluating liquidity may consider the following:
- Trading volume
- Bid-ask spread
- Market depth
- Number and size of available orders
- Price impact of larger orders
Therefore, simply selecting a security because it shows a large volume number may not provide the complete picture.
How Traders Use Volume Around Support and Resistance
Support and resistance are important concepts in technical analysis.
Support refers to an area where traders watch for buying interest or a slowdown in selling pressure.
Resistance refers to an area where traders watch for selling pressure or difficulty in further price appreciation.
Volume can provide additional information around these zones.
Suppose a stock repeatedly approaches ₹600 but fails to move above it.
If the stock later crosses ₹600 with considerably greater-than-normal volume, traders may pay closer attention to the breakout.
Alternatively, suppose the stock repeatedly holds support around ₹550.
If it suddenly falls below ₹550 with significant volume expansion, traders may interpret the move differently from a minor intraday dip below support.
The key principle remains:
Price level + price behaviour + volume + context
rather than volume alone.
What Is a Volume Spike?
A volume spike occurs when trading volume suddenly rises significantly above its normal level.
For example:
Normal daily volume: 5 lakh shares
Current session volume: 20 lakh shares
That fourfold increase would immediately attract attention from volume-focused traders.
But a volume spike does not automatically mean that a stock is bullish.
Volume may increase because of:
- Earnings announcements
- Corporate actions
- Regulatory developments
- Large transactions
- Positive news
- Negative news
- Market rumours
- Index changes
- Institutional activity
- Sudden volatility
The first question should, therefore, not be:
“Is high volume bullish?”
A better question is
“Why has activity increased, and what is price doing while it increases?”
Popular Volume Indicators Used by Traders
Several technical indicators incorporate volume information.
Understanding what they measure is more important than simply adding every indicator to a chart.
Basic Volume Bars
The simplest indicator is the standard volume histogram below a price chart.
Each bar represents the volume traded during the corresponding price period.
Traders can quickly compare the following:
- Today’s activity
- Previous sessions
- Breakout periods
- Pullbacks
- Unusual spikes
It is often enough for basic price-volume analysis.
Volume Moving Average
A volume moving average smooths volume data over a chosen number of periods.
For example, a 20-day average volume provides a benchmark against which today’s trading activity can be compared.
Suppose
20-day average volume = 6 lakh shares
Today’s volume = 15 lakh shares
Today’s activity is substantially above its recent average.
A trader can then investigate what caused the increase and how price responded.
On-Balance Volume (OBV)
On-Balance Volume, commonly known as OBV, is a cumulative technical indicator combining price direction with trading volume.
In simplified terms:
- Volume is added when price closes higher.
- Volume is subtracted when price closes lower.
Traders sometimes compare OBV’s direction with the stock’s price trend to study whether the two are moving together or diverging.
OBV should not be treated as a standalone prediction tool.
Volume Weighted Average Price (VWAP)
VWAP stands for Volume Weighted Average Price.
It calculates an average trading price while taking volume into consideration.
VWAP is particularly common among intraday traders because it provides a volume-weighted reference price for the session.
Traders may compare the current market price with VWAP while assessing intraday market structure.
However, being above or below VWAP alone does not constitute a complete trading strategy.
Accumulation/Distribution Indicator
The Accumulation/Distribution indicator combines price positioning and volume to estimate buying and selling pressure.
Some traders compare the indicator with price to identify potential confirmation or divergence.
As with other technical indicators, it should be interpreted alongside broader market information.
How Is Volume Used in Intraday Trading?
Intraday traders typically operate on shorter timeframes, making real-time changes in market activity especially relevant.
An intraday trader may monitor the following:
- 1-minute volume
- 5-minute volume
- 15-minute volume
- Relative volume
- VWAP
- Breakout volume
- Opening-session activity
For example, suppose a stock has spent the morning consolidating between ₹320 and ₹325.
It then crosses ₹325.
An intraday trader might check whether the breakout is accompanied by increasing activity compared with previous 5-minute candles.
Rather than buying simply because volume increased, an experienced trader may evaluate the following:
Price structure → volume → volatility → market direction → risk
This approach provides more context.
How Is Volume Used in Swing Trading?
Swing traders typically hold positions for longer than intraday traders, often analyzing daily or multi-day charts.
Volume can be useful for examining:
- Multi-day breakouts
- Trend continuation
- Support zones
- Resistance zones
- Pullbacks
- Consolidation
- Potential reversals
Suppose a stock spends three weeks consolidating between ₹900 and ₹950.
If it moves above ₹950 on substantially greater-than-normal daily volume, a swing trader may investigate whether a new price movement is developing.
The trader may then monitor whether ₹950 begins functioning as support.
How to Read Volume During a Breakout: A Simple Example
Consider a hypothetical company called ABC Ltd.
For the past month:
Resistance: ₹500
Support: ₹460
Average daily volume: 5 lakh shares
ABC trades between ₹460 and ₹500 for several weeks.
One day:
Opening price: ₹495
High: ₹518
Closing price: ₹512
Volume: 13 lakh shares
The stock has moved above ₹500, and volume is more than double its recent average.
A trader analyzing this setup could ask:
Did price close above resistance?
Yes. A close above the level may be more meaningful than a temporary intraday move.
Was volume unusually high?
Yes. Compared with the hypothetical 5-lakh average, 13 lakh shares represent significantly higher activity.
Does the price sustain above ₹500?
This needs to be observed in subsequent trading.
Is there company-specific news?
A sudden volume increase can be event-driven, so understanding the reason matters.
What is the broader market trend?
A breakout occurring during broader market strength can have a different context from one occurring during extreme market weakness.
Where does the trading idea become invalid?
Risk planning is essential before acting on any technical setup.
This example shows why traders generally should not interpret volume in isolation.
Can Volume Help Identify Potential Reversals?
Volume can sometimes help traders identify areas where market behavior is changing.
Imagine a stock has fallen sharply for several sessions.
Suddenly, the stock experiences extremely high volume and a wide intraday price range.
A trader may investigate whether the move represents the following:
- Continued selling
- Panic activity
- Short covering
- New buying interest
- Event-driven volatility
The volume spike itself does not prove that the bottom has been reached.
Confirmation may require subsequent price action.
Similarly, unusually high volume after an extended rally does not automatically indicate a market top.
Can Volume Predict Stock Prices?
No indicator can consistently tell traders exactly where a stock will trade next.
Volume primarily describes trading activity that has occurred or is occurring.
It can help traders assess participation behind a market move, but future prices remain uncertain.
This distinction is especially important for beginners.
SEBI’s investor education resources emphasize that securities-market investments carry risk and that returns are not guaranteed.
Instead of asking:
“Can volume tell me which stock will rise tomorrow?”
A more useful question is the following:
“What does current volume tell me about participation behind the present price movement?”
That mindset makes volume an analytical input rather than a prediction machine.
Is High Trading Volume Good or Bad?
High trading volume is neither inherently good nor bad.
Consider four scenarios.
High Volume + Strong Price Rise
There is increased activity during an upward move.
High Volume + Sharp Price Fall
There is increased activity during a downward move.
High Volume + Little Price Movement
Large trading activity may be occurring without significant directional movement.
High Volume + Breakout
Traders may consider whether the increased participation strengthens the technical significance of the breakout.
This demonstrates why volume needs price context.
Simply scanning for high-volume stocks without understanding what is happening to price can result in incomplete analysis.
What Is Volume Divergence?
Volume divergence occurs when price and volume appear to behave differently from what a trader expects within the existing trend.
For example, imagine a stock continues making new highs, but volume consistently decreases.
Some traders may interpret the pattern as weakening participation.
Another example could involve a stock making lower lows while selling volume gradually contracts.
Traders might examine whether selling participation is changing.
However, divergence can persist for long periods and should not be treated as an immediate reversal signal.
Common Mistakes Traders Make While Using Volume
Assuming High Volume Means Buy
High volume only indicates substantial trading activity. It does not automatically tell you whether a stock should be bought.
Using Volume Without Price
Volume becomes much more meaningful when combined with price action.
Treating Every Volume Spike as a Breakout
Volume spikes can occur because of news, corporate events, large transactions, or sudden volatility.
Ignoring Historical Average Volume
Absolute volume has limited meaning without context.
Compare a stock with its own historical trading activity.
Ignoring Liquidity
High reported volume does not eliminate the need to evaluate bid-ask spread, order-book conditions, and potential execution impact.
Entering Immediately After a Volume Spike
Sudden activity can attract attention, but it does not guarantee that the existing move will continue.
Ignoring News
Always check whether unusual activity is connected to company or market developments.
Using Too Many Indicators
Adding OBV, VWAP, multiple moving averages, and several momentum indicators can sometimes make analysis unnecessarily complicated.
Use indicators that answer a specific analytical question.
Ignoring Risk Management
Even technically convincing setups can fail.
SEBI advises investors to understand the risks associated with investments and conduct appropriate research.
Volume Analysis Checklist for Traders
Is current volume actually unusual?
Compare it with recent average volume.
What is price doing?
Rising, falling, consolidating, or breaking out?
Where is the stock trading?
Near support, resistance, previous highs, or previous lows?
Is there a breakout or breakdown?
Determine whether an important price level has actually been crossed.
Did price close beyond the level?
An intraday move and a closing breakout can provide different information.
Is there relevant news?
Understand why activity may have changed.
What is the broader market doing?
Market-wide conditions can influence individual stocks.
Is liquidity adequate?
Consider spreads and execution conditions in addition to volume.
Is there follow-through?
Watch what happens after the initial volume expansion.
What happens if the analysis is wrong?
Risk management should be planned before a trade rather than after the market moves against it.
Volume Analysis vs Fundamental Analysis
Volume analysis and fundamental analysis answer different questions.
Volume analysis focuses primarily on market behavior and trading activity.
Fundamental analysis evaluates factors such as:
- Revenue
- Profitability
- Balance sheet
- Cash flow
- Business model
- Industry position
- Valuation
- Growth prospects
A company can have excellent fundamentals but experience short-term selling pressure.
Similarly, a stock can experience a sudden high-volume rally without any meaningful improvement in its underlying business.
Traders therefore need to choose analytical tools according to their timeframe and objectives.
Should Beginners Use Volume Analysis?
Yes, beginners can learn volume analysis because the fundamental concept is relatively straightforward.
However, they should start with simple questions rather than complicated indicators.
Begin with:
What is the price doing?
Then ask:
What is volume doing?
Next:
Is current volume normal or unusual?
Finally:
Where is this happening on the chart?
For example:
Resistance + breakout + increasing volume
provides more information than:
High volume
alone.
As traders gain experience, they can gradually learn concepts such as VWAP, relative volume, OBV, and price-volume divergence.
Final Thoughts: Why Traders Should Understand Volume in the Stock Market
Understanding volume in stock market analysis gives traders another way to interpret what is happening behind price movements. Volume can help identify changes in market participation, provide context around breakouts and breakdowns, highlight unusual trading activity, and support the analysis of trends, liquidity, support, and resistance.
But volume should never be treated as a guaranteed predictor of market direction. A stock can rise on high volume and reverse; a low-volume breakout can still continue; and unexpected news can quickly change technical conditions. Securities-market participation involves risk, and SEBI’s investor resources emphasize understanding those risks and avoiding assumptions of guaranteed returns.
The most useful approach is to combine price action, volume, trend, market structure, liquidity, relevant information, and disciplined risk management. Instead of asking whether volume alone gives a buy or sell signal, traders should use it to understand the quality and context of market activity.
For traders looking for a technology-focused trading experience, Lares Algotech provides access to the Indian securities market with an emphasis on technology, execution infrastructure, and modern trading capabilities. Traders searching for the best stock broker in India should evaluate factors such as regulatory status, execution quality, platform reliability, costs, risk-management systems, customer support, and the services relevant to their individual trading requirements before choosing a broker.